Blog
A few weeks ago, we released the latest version of the Certification Monitor. This update includes the following points:
- Benchmark – Deviation Inbox Placement – allows you to compare the deviation of the inbox placement rate to the previous day with all other certified senders
- Combined trend graphs – show two KPIs simultaneously, making it easier to identify and analyse correlations
- Anomaly detection – shows the deviation of the inbox rate and spam complaint rate to provide an indicator of improvement or deterioration
- News – Informed about news and updates
- Alert Management – reports can be activated here via email or webhooks
- Updated user profile – individual management of global alerts is now possible
But what do I do with all this beautiful new data? How should I interpret it?
Let’s take a look at the Benchmark Report on Deviation Inbox Placement. First of all, this is a rather unwieldy term. However, the data behind it can help a sender better assess their sending behaviour.
The data is used to anonymously compare the change in one’s own deliverability with the change in the deliverability of all other certified CSA senders. The chart shows the standard deviations of the Inbox Placement Rate (IPR) of all certified customers without naming the senders and without publishing the actual IPR.
The grey vertical bar represents the standard zero position. A deterioration in the inbox placement rate is shown in red on the left-hand side, i.e. as a negative deviation, while an improvement is shown in green on the right-hand side, i.e. as a positive deviation.
Example analyses
Example 1: Stable deliverability performance
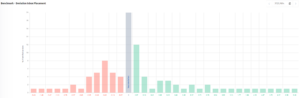
In this first example, you can see that the IPR of our sample sender has not changed compared to the previous day. The bar is shown in neutral grey. This also applies to 19 other CSA certified senders. A grey bar indicates a stable deliverability performance and therefore no deviation from the previous day.
Example 2: Improving deliverability performance
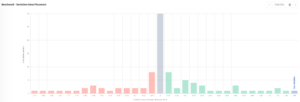
In the second example, the IPR of our sample sender has improved by 2.97%. The majority of CSA certified senders were unable to improve on that day (all senders represented by the green bars).
Example 3: Deterioration of deliverability performance
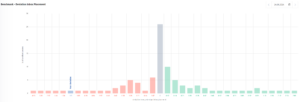
This third example shows that our sender’s IPR has deteriorated by -1.2% compared to the previous day. This makes it one of the few in the red zone (negative deviation), while most other CSA-certified senders have either remained stable (grey bar in the middle) or improved (green zone for positive deviation). This indicates that something in their own performance is not optimal and that the sender should investigate the cause.
Conclusion
The Benchmark Report on Deviation Inbox Placement has now been moved to the dashboard. This feature lets senders quickly see how their Inbox Placement Rate has developed. If you use this tool regularly, you can identify trends early and take countermeasures if necessary. The comparison with other certified senders also allows you to assess your own performance better.